


Table of Contents
Takeaway #1: The 5-Second Deception (Why You Should Ignore Short Calls)
Takeaway #2: The Hidden Abandonment in Your IVR
Takeaway #3: When a Low Rate is a "Bad" Sign (The Efficiency Trap)
Takeaway #4: The Power of the "Visible Queue" and Average Patience
Takeaway #5: Managing the "Random Arrival" Reality
In 1997, British Airways decided to celebrate its 100th privatization anniversary with a special promotion. You had to call a hotline, and if you could get through, you had a chance to buy Concorde tickets from the UK to New York for a negligible fare of £10, instead of the normal £5,400. An astonishing twenty million calls rained on the poor Newcastle contact center, which albeit double-staffed, could do little else than route the vast majority of them to a pre-recorded message ending with "thank you for calling". The lucky few kissed by the IVR gods that actually got a line were more than willing to let their beefy 1997 mobile phone battery almost run out while in queue.
That day was a rare occurrence of the simplifying assumption of the Erlang C formula being true: nobody ever abandons the queue! That would be good for the maths, but unfortunately (?) your customers will never be that motivated. People constantly hang up while in queue. In this post we will see how to give a correct mental frame to call abandonment: how to calculate it, its many subtleties, and what to do to manage it.
Call Abandonment Rate Formula
Defined simply, Call Abandonment Rate is the percentage of inbound callers who disconnect before reaching an agent.
While many view it as a simple operational KPI, a high abandonment rate might be a diagnostic signal of systemic failure. It is the silent killer of loyalty; when a customer "abandons," they aren't just hanging up: they are often walking away from your brand entirely. This is why it's crucial to get a high-resolution picture of the situation.
The subtleties of abandonment
Understanding this metric requires moving past simple averages and into the more complex innards of human patience and interaction. Here are five crucial aspects that a serious analysis must take into account.
Takeaway #1: The 5-Second Deception (Why You Should Ignore Short Calls)
Calculations should typically exclude calls abandoned within the first five seconds. Including these "short calls" leads to data that is technically accurate but strategically useless. There are two primary drivers for these disconnects:
- Misdials: The customer realizes they dialed the wrong number.
- Redialing Anxiety: The customer dials the correct number, then hangs up and redials the same number out of doubt that they mistyped a digit.
Filtering these hangups ensures your abandonment rate reflects genuine queue frustration rather than accidental human error.
Takeaway #2: The Hidden Abandonment in Your IVR
A major operational blind spot is failing to track abandonment on the "telephone network side." Many managers only track hangups once the caller enters the agent queue. However, an overly complex IVR is a barrier. In one documented case study, a company discovered that 18% of their abandonment was hidden within the IVR itself.
However, a senior strategist also looks for "Deflection Abandons" (Success). If an IVR announcement (e.g., "Our website now handles password resets") leads to a hangup, that is a successful deflection, not a service failure. You must differentiate between Frustration Abandons and Deflection Abandons to understand your IVR’s true efficacy.
Takeaway #3: When a Low Rate is a "Bad" Sign (The Efficiency Trap)
A low abandonment rate can be a "Peril of Vanity Metrics." Operations can manipulate these numbers through tactics that destroy CX:
- Screen Groups: A "front-line" person answers the call purely to stop the clock, only to transfer the caller to another queue. The call is "answered" in the reports, but the customer's query remains untouched.
- Holding Patterns: Traffic controllers may put blocks of queued calls into holding patterns, allowing new arrivals to go straight to agents to keep the current Service Level looking stable.
- Resolution Gaps: You can have 0% abandonment, but if the query isn't resolved or the customer must call back three times, the low rate is masking a total failure in service quality.
Takeaway #4: The Power of the "Visible Queue" and Average Patience
The "Invisible Queue" (waiting in silence) generates more irritation than the wait itself. This is governed by Average Patience, also known as Average Time to Abandon (ATA).
By implementing a Visible Queue (announcing wait times) or a Virtual Queue (callbacks), you effectively eliminate the frustration of waiting. A callback doesn't eliminate the wait time, but it preserves the customer's place in line while giving them back their "Time Available", which is one of the seven factors of customer tolerance.
Takeaway #5: Managing the "Random Arrival" Reality
Staffing for "daily averages" is the fatal mistake of contact center management. Customer contacts do not arrive in a smooth flow; they arrive in Random Arrival patterns—they "bunch up."
- The Analogy: Think of an ice cream stand. You can predict Saturday will be busier than Tuesday, but you cannot predict the exact minute five groups will arrive at once.
- The Power of One: In queuing theory, a single agent's presence can drastically shift the abandonment curve. This is why staffing for the "mean" results in being understaffed 50% of the time.
You must staff for the peaks of 15- or 30-minute intervals. Failing to account for this randomness leads to "peaked" traffic surges that cause abandonment spikes from which the queue can never recover.
Get the full picture
Often, senior managers strategists resort to the Erlang A formula, an extension of the simpler Erlang C model taking into account the patience of the caller, to predict the abandonment rate given the staffing. While a good start, this is error-prone. The reason is that the Erlang A model still works in a "steady-state" regime, failing to gauge the many dynamical effects the contact center experiences in reality. Spoken plainly: when period T starts, you are inheriting the queue resulting from period T-1, and this is true along the entire day. For instance: if you systematically start period T with a substantial and "old" queue, the numbers might be off. Staffing changes abruptly when shifts rotate. Not to mention that, if your contact center is blended and multi-skill, the intricate interactions between different queue and agent activities can muddle the picture entirely.
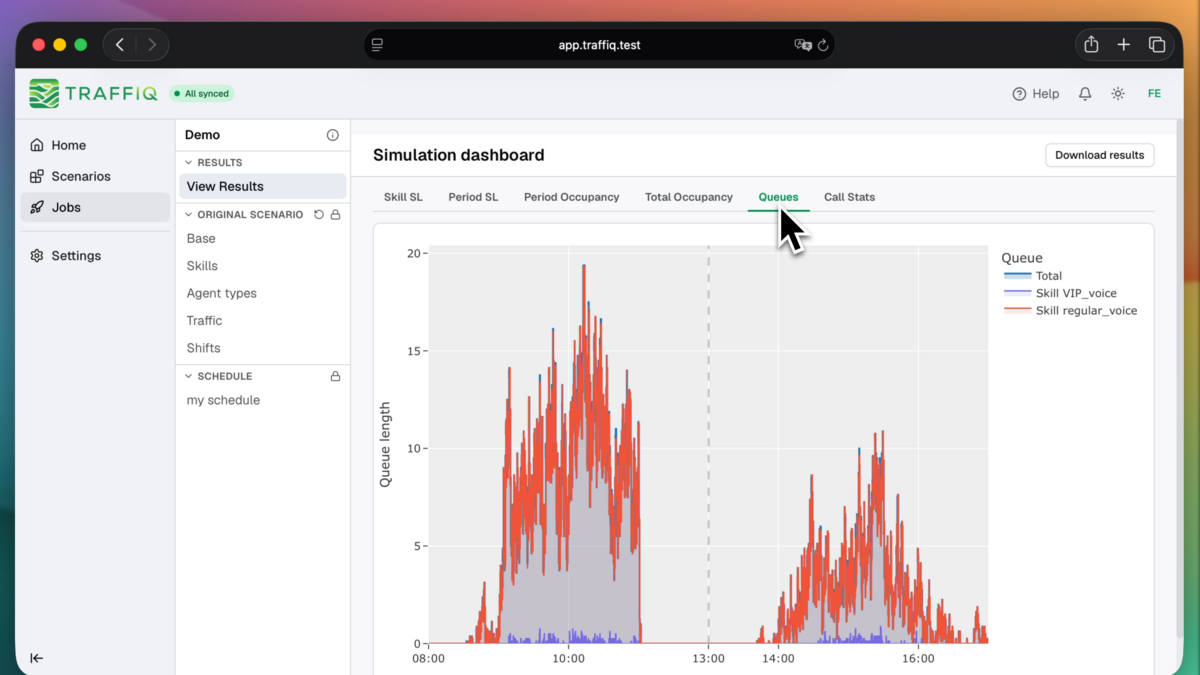
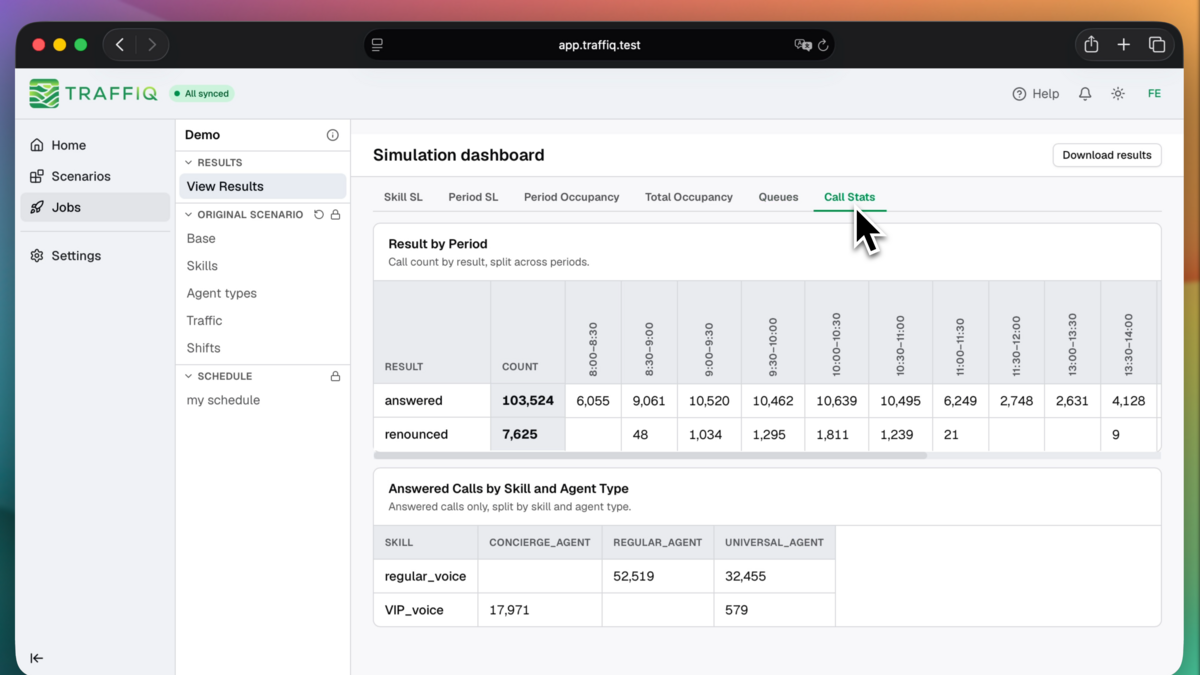
To get trustworthy numbers in the complex general case, there is no alternative to simulation. This is where a tool like Centiviq can seriously help you: insert the data and get a full-resolution replica of the situation, taking into account priority routing quirks and the full dynamics of the contact center. At the end, you get a prediction of the full evolution of the queue and detailed call stats, including abandoned calls. Centiviq is in development and its launch is programmed for Q1 2027; in the final platform, you will get even more detailed data, such as breakdown by skill, a histogram of abandon times and much more.
Practical Strategies for Reduction
To lower abandonment, you can consider a few actionable strategies, if they match your operations:
- Real-time Dashboarding: Use live monitors to track wait thresholds. When limits are breached, reallocate staff from back-office tasks to the "hot" queues immediately.
- Self-Service Deflection: Invest in IVR or web portals that solve common issues (Success Abandons). This reduces the "offered" call volume, lowering the pressure on your agents.
- Improved In-Queue Messaging: Avoid repetitive loops. Identify when your ATA (Average Time to Abandon) typically triggers and change the music or messaging at that specific interval to refresh the caller’s patience.
- Scale up multi-skill: You might find yourself in periods where a queue is saturated while some agents that cannot consume that traffic are unloaded. Multi-skill helps you benefit from statistical averaging opportunities.
- Call blending: If you can face queue spikes with agents that are otherwise performing outbound campaigns, which are intrinsically not time sensitive, that's a clear win. Think of it as on-demand overstaffing, with no waste.
The Industry Benchmarks
Benchmarks vary by industry based on the degree of motivation on the caller's part. For example, technical support callers have higher patience because the agent holds specialized, necessary knowledge.
| Performance Level | Abandonment Rate | Context/Industry Note |
|---|---|---|
| Excellent | 2% | The gold standard for Retail/E-commerce. |
| Acceptable | 5% - 8% | Typical for Financial Services or Utilities. |
| High Territory | 10%+ | Problematic; indicates significant lost revenue. |
Note: In competitive Retail, 5% is often unacceptable because every abandon is a lost sale. In Technical Support, a higher rate may be tolerated if the resolution quality is high.
Conclusion: Beyond the Number
Abandonment rate is a prerequisite for quality, not a replacement for it. The British Airways "Concorde" Case Study proves the power of motivation: when callers were vying for free tickets, millions attempted to call and abandonment was negligible despite massive waits. They were motivated. Your customers, however, are usually motivated by a need for help, not a prize, and they want to be done as fast as possible.
Reducing abandonment is about respect: respecting the customer's time and their intent. As you review your next report, ask yourself: is our abandonment rate telling the truth about our customer experience, or is it just masking the holes in our IVR?